

2026 Tournament Competitiveness
One question the board gets asked often is about the fairness of our tournaments, the Cinnabar Cup points race, and our end of season Match Play tournaments. In addition to following all USGA guidelines and policies for handicapping our tournaments to ensure everyone has an equal chance of winning (regardless of handicap), in 2025 we began tracking and compiling data from all our tournaments to confirm that was actually happening.
Below you’ll find a summary of the analysis we’ve done. The first section provides the end of season results and analysis for all regular season tournaments played played in 2026. The second section focuses on our end of season Match Play tournaments from 2024 and 2025 (the NET Championship, and our “Ryder Cup” style Cinnabar Cup tournament). Since the Club Championship is played at scratch golf (no handicaps), we don’t include it in the analysis.
While our personal experiences don’t always line up with the results we’d like to have, given our analysis, the Board is very confident in the fairness of all our events and find they are well within the expected results (based on USGA published data).
2026 Regular Season and Cinnabar Cup Points Race
The table below summarizes the 2026 end of season results from all our tournaments (through the regular season). It tracks how each member finished in each tournament based on their Tournament Index (handicap). The column labeled “Field” shows the percent of all rounds played by members in each handicap group this season. The other columns show the percent of rounds where members of each handicap group either won the tournament or finished in the Top 3, Top 5, Top 10, or Top 20 respectively.
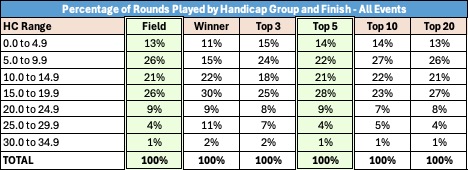
Assuming every member has an equal chance of winning every tournament, then over time (e.g. by the end of the season) we expect the percentages in each “finishing column” to roughly equal the percentages in the “Field” column
For example, members with TIs between 0.0 and 4.9 have played 13% of the total rounds year-to-date and have placed in the Top 5, 14% of the time. Thus, this handicap group did about what we expecte them to do this year. Likewise, members with TIs between 5.0 and 9.9 have played 26% of the total rounds year-to-date but placed in the Top 5 only 22% of the time (slightly underperforming what we expected).
The board reviews the above data at every board meeting (by tournament and by YTD) to ensure the formats and handicap allowances offer every member an equal chance to win; and by the end of the season we expect any differences in the different groups (especially between the “Field” and “Top 5” columns to narrow further.
The only real outliers we saw this year is in the 25.0 to 25.9 handicap group. While they represent 4% of the rounds played finished in the “top 5” 4% of the time (which what we would expect), they had a higher than expected “Winner” percentage (11%) and “Top 5%” (7%). Given we played only 23 tournaments, this could just be an anamoly, but it something the board will watch closely in 2027 to see if this continues.
In addition to the above, we track how each handicap group is doing in the Cinnabar Cup Points Race. The table below summarizes the results for the points race thus far and shows how many players we would EXPECT (given the number of playing members in each handicap group) in the Top 10 and Top 20 of the Cinnabar Cup standings compared to the number that are currently in the Top 10 and Top 20.
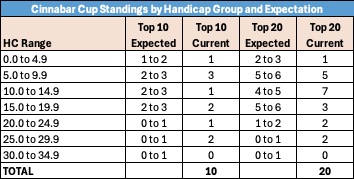
While the distribution for 2026 is much more balanced than it was in 2025, and while the Top 10 spread looks reasonable, the Top 20 is less balanced and something we’ll watch closely in 2027.
Match Play Tournaments
To analyze our Match Play results, we reviewed all matches played during 2026 (as well as 2024 and 2025). For each match we looked at who won (the lower HC player or the higher HC player), how many strokes they were given/received, and how many strokes they won the match by. Note: matches where there were no strokes given/received were not included in the analysis.
The USGA recommends a handicap allowance of 100% for match play matches, so both members in the matches played with their full handicaps. Assuming the USGA recommendation is “fair”, we would expect the lower HC and higher HC players to win ~50% of the time each.
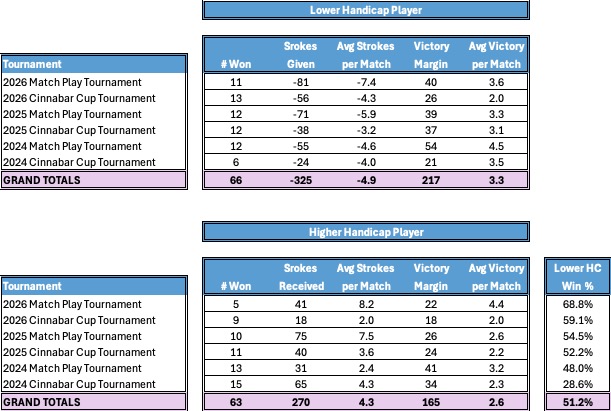
The first column in the each table shows the number of times the lower HC and higher HC players won in each match. To the far right of the second table you see the number of times the lower HC beat the higher HC player as a percentage of total matches played. As you can see, lower HC players beat higher HC players n the 2026 Match Play tournament 68.8% of the time and in the 2026 Cinnabar Cup tournament they won 59.1% of the time. This is despite giving up 7.4 strokes on average in the 2026 Match Play matches they won and 4.3 strokes in the 2026 Cinnabar Cup tournament.
While the 2026 statistics would indicate the USGA handicap allowance is more than fair for members with low handicaps, even when they are giving up a large number of strokes, we ultimately want to look at the combined 2025, 2025, and 2026 data to get a better view (statistics is always better when you have more data). And here we can see the stats balance out over time, with low handicap players winning 51.2% of the time (much more balanced).
NET-NET, the board continues to feel playing our Match Play tournaments (not the Club Championship which is played without handicaps) are very competitive and fair at the 100% handicap allowance recommended by the USGA.