

2025 Regular Season & Match Play Analysis.
One question we get asked constantly is about the fairness of our tournaments, the Cinnabar Cup points race, the Match Play tournaments, etc. The USGA and R&A have done extensive studies into handicapping tournaments and established handicapping allowances and polices to use in member sponsored events. These are designed to give all players a similar chance of finishing in the top 10% when playing well.
Our association follows all the USGA guidelines and policies for handicapping our tournaments, in both stroke play and match play. We also recently conducted reviews of the results across the 2025 regular season and Match Play tournaments. While our personal experiences don’t always line up with the results we’d like to have, we’re very confident in the fairness of all our events and find they are well within the expected results (based on USGA published data).
2025 Regular Season and Cinnabar Cup Points Race
As part of the 2026 Tournament and Policy changes, in 2026 we will be allocating Cinnabar Cup points based on how each member finishes compared to the entire FIELD using NET scoring. Prior to making this decision the board conducted a review of what the 2025 season and Cinnabar Cup Point Race would have looked like using the new method.
To conduct this review, we rescored every 2025 tournament as NET scoring across the field, and calculated who would have been the winner, who would have placed in the top 3, the top 5, the top 10, and the top 20. We then categorized each member into low handicap (TI < 10), mid handicap (TI < 20), and high HC (TI > = 20) based on what their handicap was when they played the tournament; after which we aggregated this data across ALL tournaments to the results you see in the table below.
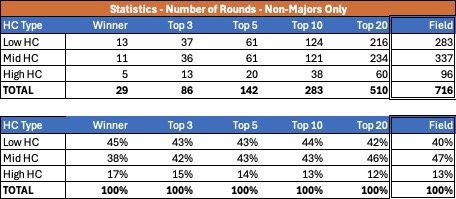
The far right column in the table shows the total number of rounds (716) included in the analysis across 15 regular season events. It does not include the majors since they have a handicap maximum of 18.4 which skews the data. The other columns show how many rounds by handicap category and finish. They are more winners (29) than rounds (15) because of 2 and 4 man team events, which count both/all the playing partners as winners (same with the other categories.
Looking at the last column, you see that 40% of the rounds played were by low HC players, 47% by mid HC, and 13% by High HC. The USGA handicap allowances aim for players of different handicaps to have an equitable (50%) chance of finishing in the upper 10% of an event. Given we have ~50 members playing in each event, the upper 10% is represented by the Top 5 column. Thus we would expect the percentages in the Top 5 to be within the margin of error (which is 2-3% for our data at 99% confidence) of the last column in our table.
The data above shows we are at the edge of the margin of error for the Low HC performance and slightly outside the margin of error for Mid HC performance. However, two items likely account for the deviation: 1) to break ties we use scorecard comparisons (last 9, 6, 3, and 1) holes which is essentially a random “flip of the coin”, and 2) we have a large number of team events that give multiple winners, top 3’s etc. to different members.
In 2026, we will continue to track the above metrics to ensure our competitions are fair and equitable for all members participating in them.
2025 Match Play Tournament
To analyze our Match Play results, we reviewed all matches played during 2025 (and 2024). For each match we looked at who won (the lower HC player or the higher HC player), how many strokes they were given/received based on their handicap, and how many strokes they won the match by. Note: matches where there were not strokes given/received were not included in the analysis.
The USGA recommends a handicap allowance of 100% for match play matches, so both members in the matches played with their full handicaps. Thus we would expect the lower HC and higher HC players to win ~50% of the time each.
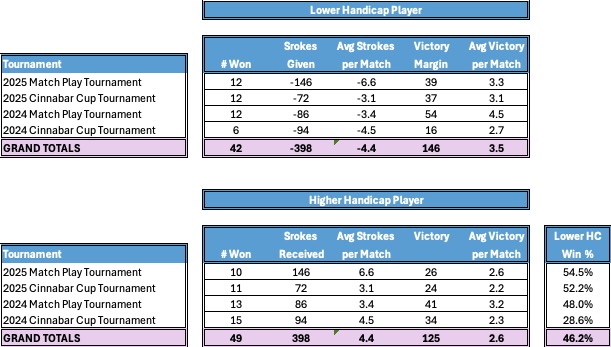
The first column in the table shows the number of times the lower HC and higher HC players won in each match. To the far left you see how many times the lower HC beat the higher HC player as a percentage of total matches played. As you can see, lower HC players beat higher HC players n the 2025 Match Play tournament, the 2025 Cinnabar Cup tournament, and the 2024 Match Play tournament 54.5%, 52.2%, adn 48% of the time (all close to 50%). The exception is the 2024 Cinnabar Cup tournament where lower HC players only won 28.6% of the time.
Of interest, lower HC players won more in the 2025 Match Play tournament than the 2024 tournament by more strokes (3.3 to 3.1) while giving up more strokes (6.6 to 3.1).
In looking at the 2024 Cinnabar Cup detail, there is no clear pattern as to why the results skewed so heavily toward the higher HC players. Given the overall win percentage for the lower HC players, across all four tournaments is 46.2%, the most likely explanation is that it is simply an outlier year, and not the norm.
We will continue to track the match play data in 2026.